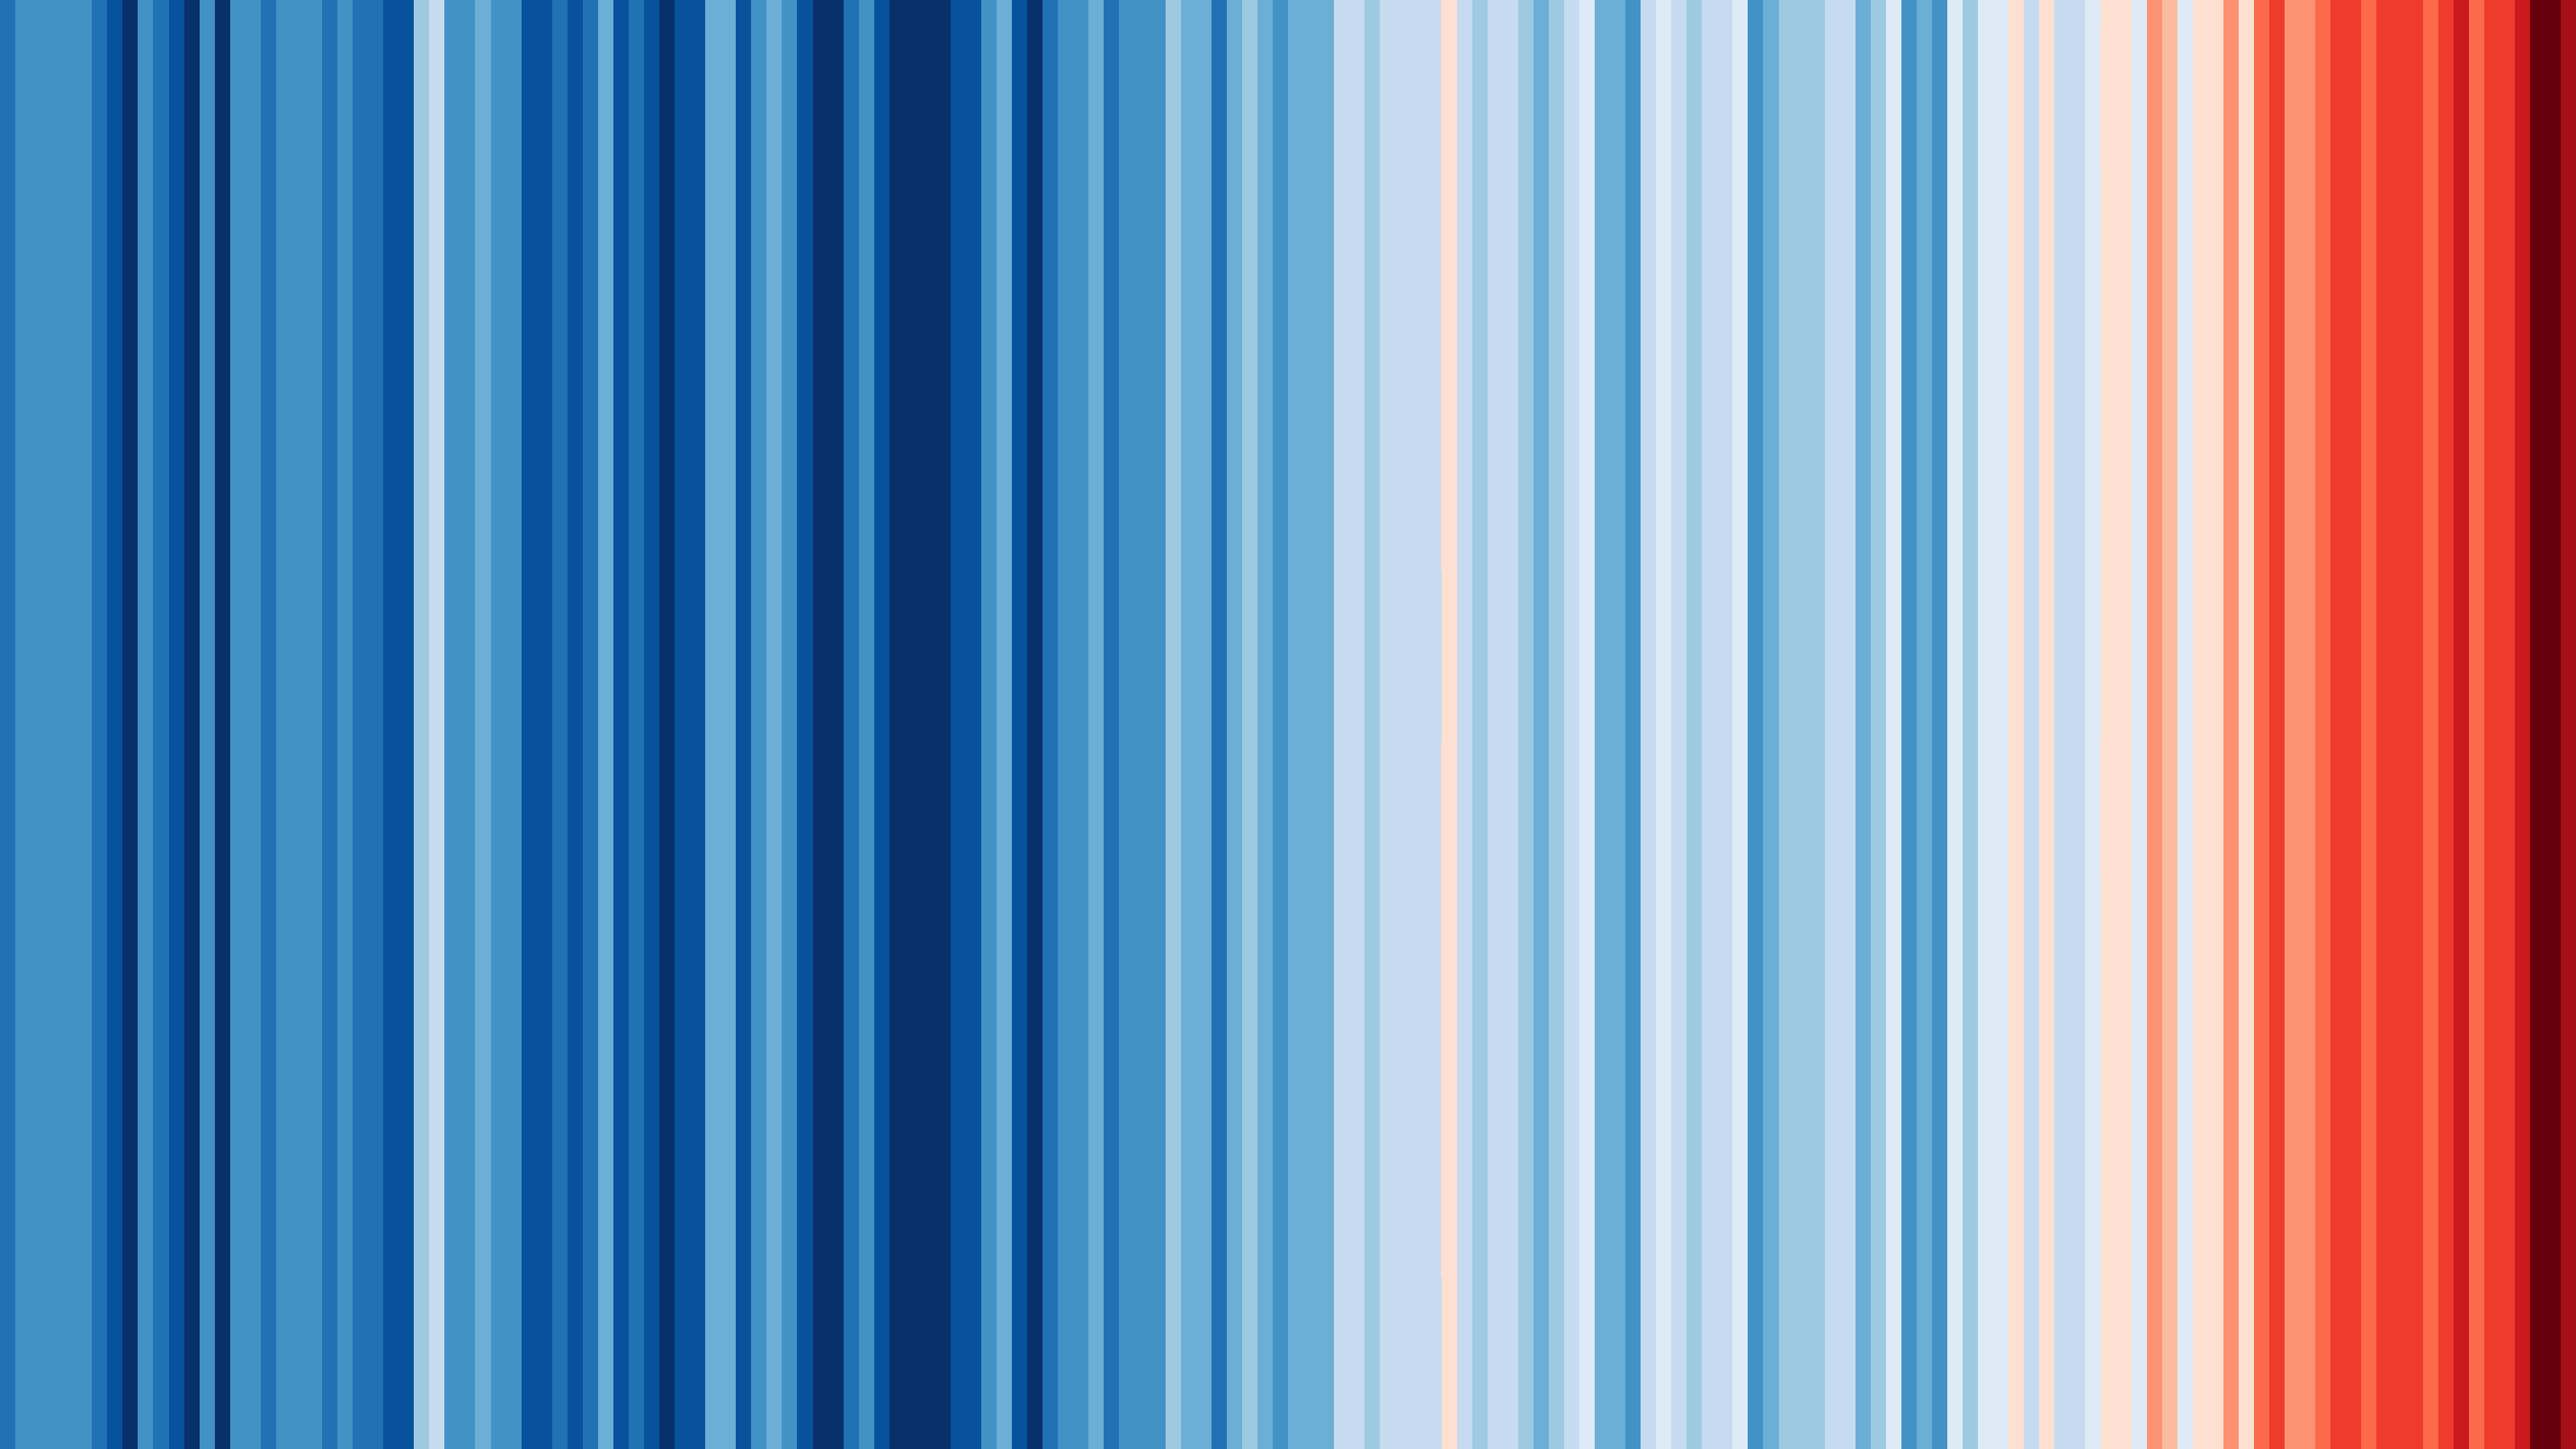
We looked at Ed Hawkins' climate stripes this week.

These show the changes in average global temperatures since 1860, moving from left to right, showing the obvious impact of warming in the last few decades.
We also need to look at these changes over much longer periods, which is what we moved on to.
This video is dramatic, and shows the impact on Greenland.
And here's NASA's visualisation of warming since 1880
The global temperature was well above average in Nov 2018. The month was— Copernicus EU (@CopernicusEU) December 11, 2018
✴️more than 0.4°C warmer than the average November from 1981-2010
✴️almost 0.2°C cooler than the warmest two Novembers
Monthly Climate Bulletin updates from our #ClimateChange service https://t.co/YitdQ0MzA3 pic.twitter.com/AtDpT4fpLO
Comments
Post a Comment